




 Landscape
GPS Trackers Testing and Troubleshooting Guide
Admin 2026-07-17 342
Any technological system may encounter various problems during actual deployment. GPS trackers are no exception—inaccurate positioning, signal loss, failure to report, insufficient battery life… these problems are almost inevitable during project implementation.
As a tracker manufacturer specializing in smart wearable health and safety monitoring, I will share a systematic testing and troubleshooting method to help you quickly locate the root cause of problems and effectively solve them, from device selection to long-term operation.
I. The Necessity of Sample Testing and Verification
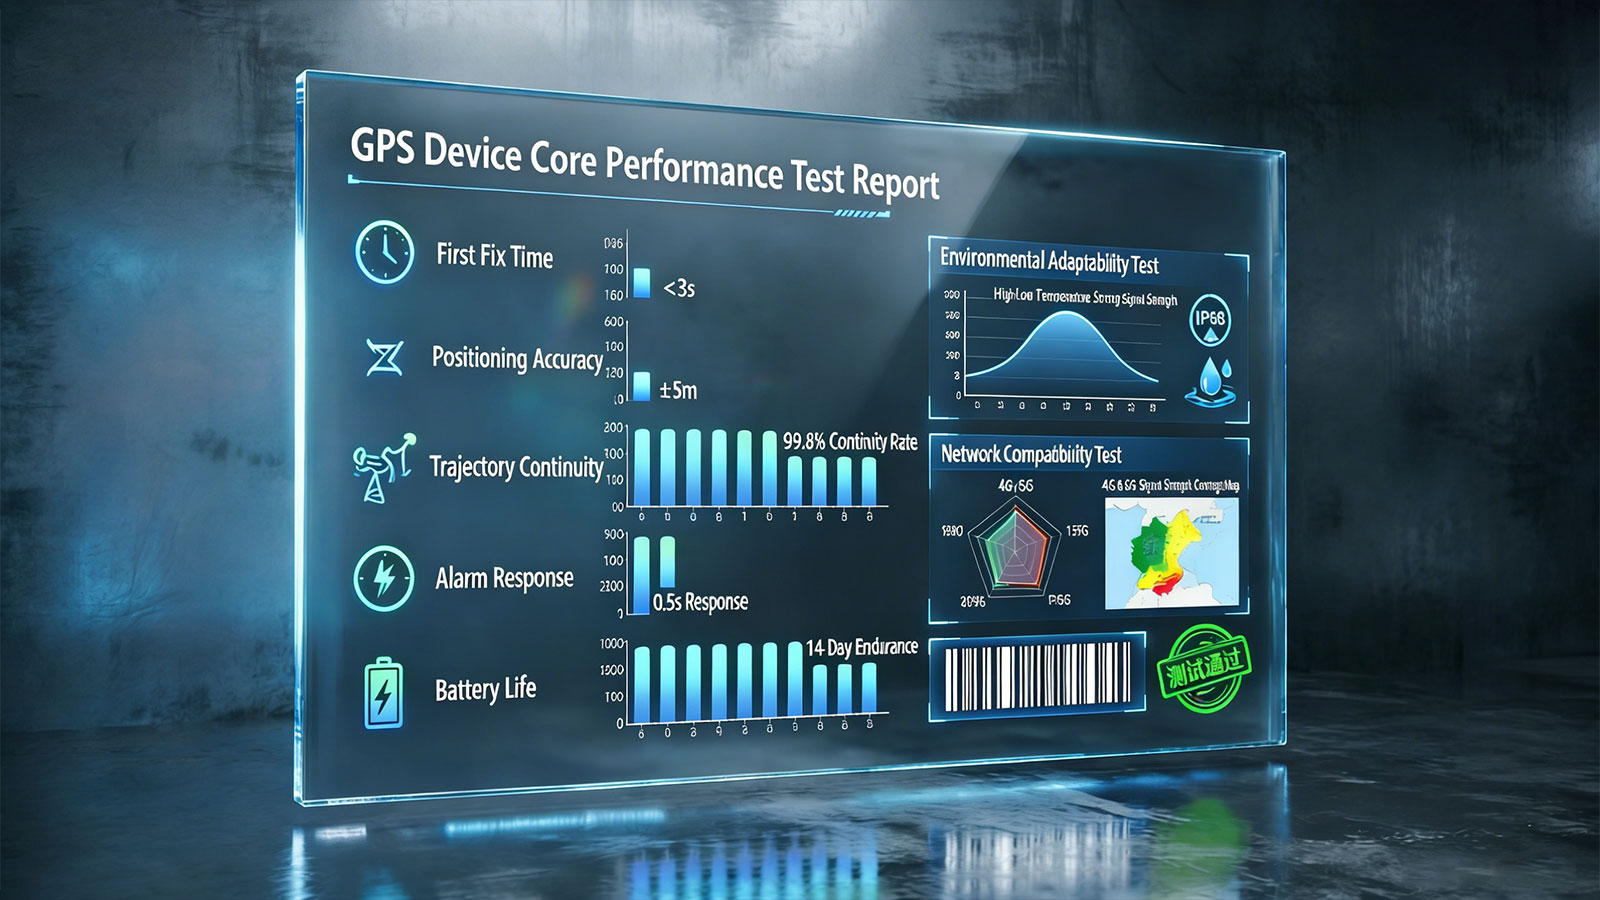
Purchasing samples and conducting thorough testing and verification before bulk order and large-scale deployment is the most effective way to avoid subsequent problems.
1.1 Core Indicators of Sample Testing
| Items | Method | Pass/Fail Standards | Remark |
| First Positioning Time | Cold start the device and record the time from power-on to obtaining the first positioning. | <60 seconds (open area) | Various differences exist between different start-up states; multiple tests and averaging are required. |
| Positioning Accuracy | Place the device at a known reference point and record 50-100 points. | CEP<5 meters in open area | Testing should be conducted at different times and in different weather conditions |
| Trajectory Continuity | Move the device and observe the continuity of the platform trajectory | No jump points out of the reporting interval | Pay special attention to turns, tunnels, and areas with tall buildings. |
| Alarm Response | Trigger various alarms and record end-to-end delays | <60 seconds | Testing should be conducted in different network environments |
| Battery Life | Run the device according to actual usage scenarios after a full charge. | Achieve 80% or more of the nominal value in the specifications | Temperature has a significant impact on battery life. |
1.2 Environmental adaptability test
| Test Items | Test Methods | Common Problems | Prediction Indicators |
| Urban Canyon | Testing in densely populated high-rise areas | Location jumps, signal loss | Accuracy decreases when HDOP value > 3 |
| Underground/Indoor | entering underground parking garages and large buildings | Complete loss of connection, trajectory lag | Requires reliance on base stations/Wi-Fi and LBS assistance |
| High-Speed Movement | testing on different speed moving | location jumps | Doppler effect |
| High/Low Temperature | extreme weather or simulated environments | Sudden battery drain, device shutdown | lithium battery capacity decreases by 30-50% at -10°C |
1.3 Network Compatibility Testing
Because different countries use different 4G network frequency bands, it's essential to test the device's network compatibility in the target country. This is why we confirm the local 4G network frequency band when you purchase a sample.
Frequency Band Support: Confirm whether the device supports 4G frequency bands that cover the target country's operators. (Contact on check on SIM Card's telecom operator website)
Roaming Function: Whether the device can switch networks normally when used across borders.
APN Settings: Whether special configuration is required to access the local network. (Contact telecom operator or How to check the APN information on Android Cellphone?
Signal Strength: RSCP/RSRP values at different locations.
II. How Does GPS Tracker Work and Data Flowing
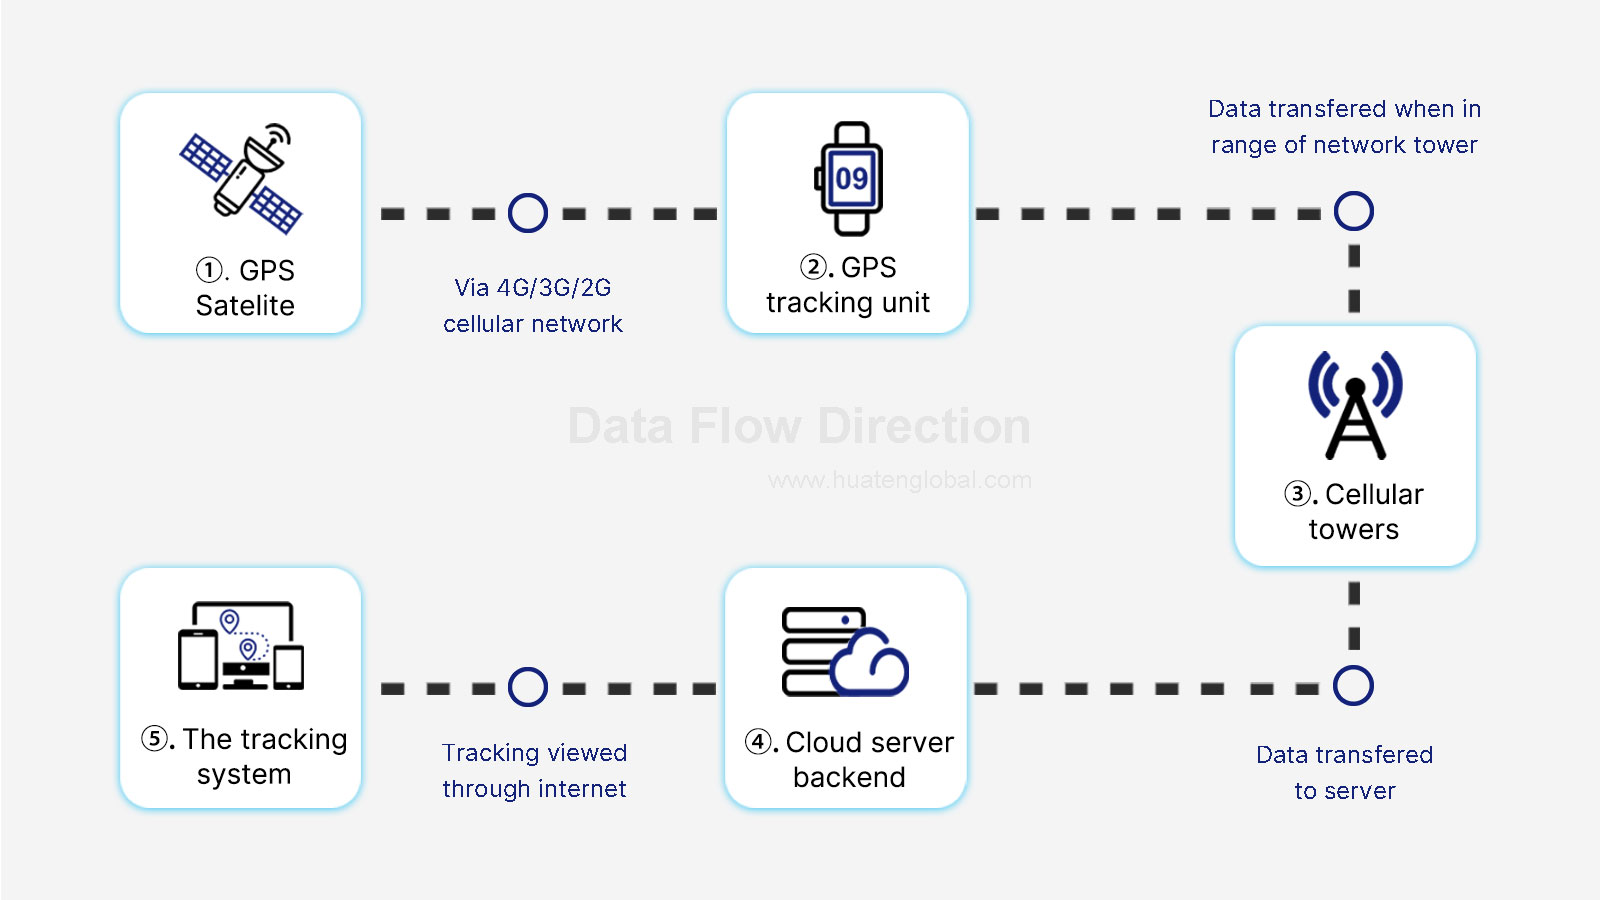
To analyze what exactly problems and troubleshoot issues, it's essential to first understand at which stage the problem might occur. As shown above, there are three main steps, plus data acquired by the device's sensors, making a total of four steps for analysis and troubleshooting.
Step 1: GPS device acquires satellite latitude and longitude data
Issue probably happens in this part if the device not have accurate location.
Step 2: Device built-in sensors measure data collection
Issue probably happens in this part if the device not upload health data or inaccurate.
Step 3: Data is transmitted to the cloud backend server via cellular network
Issue probably happens in this part if the backend doesn't receive data.
Step 4: The parsed values are transmitted to the management backend and apps via the internet.
Issue probably happens in this part if the web platform not showing correctly.
2.1 Data Flow
GPS Satellites → Tracker (Location Calculation)
↓ (via 4G cellular network)
Base Station → Internet → Cloud Server (TRACK IN360 Platform)
↓ (via 4G/Wi-Fi)
Your Mobile App
2.2 Key Points
There is no direct communication between the tracker and your phone like buetooth tracker, all data was sent to the cloud first.
Advantages of this method: Anyone, anywhere with internet access, can view the device's location (instead of having to be near the tracker).
Disadvantages: Relies on cellular network coverage; data transmission has some latency.
Note: Why the 4G tracker must required SIM card but bluetooth tracker doesn't?
2.3 Actual Feeling
When you open the mobile app and see the tracker's real-time location, the process is as follows:
(1) The GPS tracker has just uploaded a new location to the cloud via the 4G network.
(2) Your mobile app requests the latest data from the cloud every few seconds or minutes.
(3) The cloud sends the latest location to your phone.
(4) The device latest location updates on the map.
The entire process typically takes 2-60 seconds, depending on network conditions and device type.
Ⅲ. Common Problems During Testing and Troubleshooting
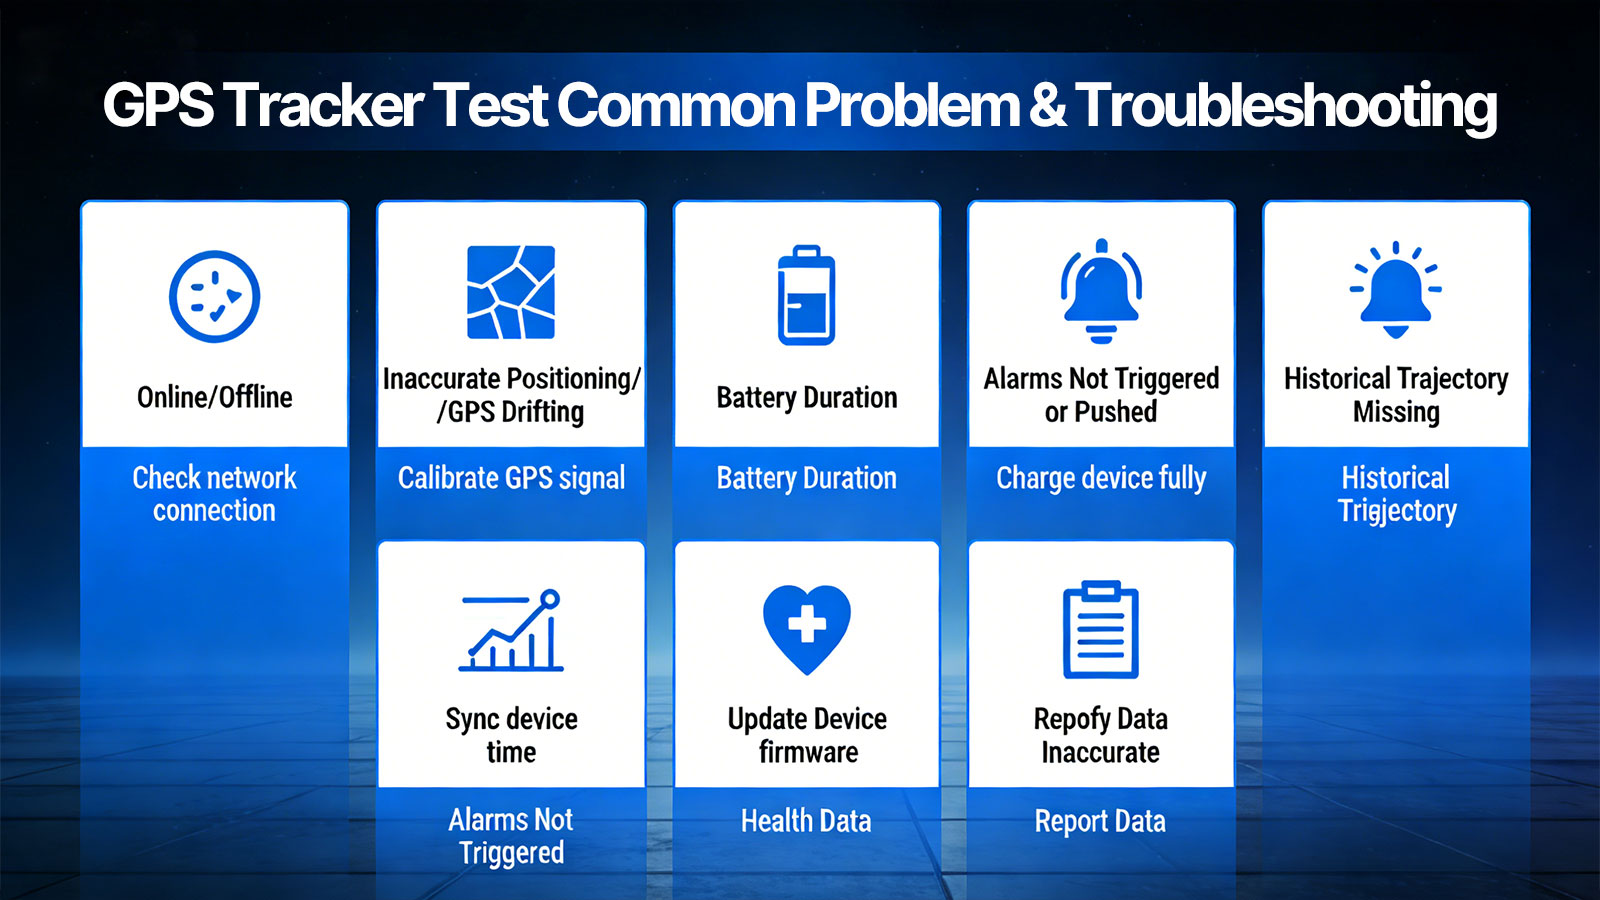
Problem 1: Device not online/offline
This is the most common after-sales problem, and there are several possible reasons:
| Steps | Check Items | Possible Causes | Troubleshooting |
| #1 | SIM card installation correct | Poor contact, incorrect orientation | Reinstall and clean contacts |
| #2 | SIM card balance due | Insufficient balance, expired plan | Top up or renew payment |
| #3 | Network signal | In a signal dead zone | Move to an open area to test |
| #4 | APN settings | Configuration error | Reconfigure the correct APN |
| #5 | Device indicator lights | No response | Device may be damaged and requires repair |
Diagnostic Tips:
Observe the device's indicator lights (most devices have LEDs to indicate network status).
Insert another known working SIM card for testing.
Send an SMS command to check if the device has recognized the SIM card (a correct response indicates recognition)
Use engineering mode to check the network registration status.
Problem 2: Inaccurate positioning/severe drift
| Phenomenon | Possible causes | Verification method | Troubleshooting |
| Static drift | Multipath effect, satellite geometric difference | Test statically in an open area | Enable static drift suppression algorithm |
| Trajectory jump | Signal obstruction, recovery after location loss | Check for missing trajectory segments | Enable inertial navigation or base station assistance |
| Fixed deviation | Is background correction set | Check if the positioning or trajectory has a fixed error ratio with the actual error | Cancel background correction |
| Fixed deviation | Antenna problem, chip calibration | Compare with known points | Hardware repair required |
| Urban canyon jump | Signal reflection | Observe by passing the same location multiple times | Use map matching algorithm |
Engineering explanation: GPS typically has an accuracy of 2-5 meters in open areas, but in urban environments, multipath effects can lead to a deviation of 10-50 meters. This is not a device malfunction, but a physical limitation.
Question 3: Battery life is far below the advertised range
| Elelement | Inspection Items | Possible Causes | Troubleshooting |
| Configuration | Reporting Interval Settings | Insufficiently high upload frequency | Adjust upload interval |
| Environment | Signal Strength | Surge in power consumption under weak signal | Optimize installation location |
| Hardware | Battery Aging | Excessive cycle count | Replace battery |
| Temperature | Ambient Temperature | Capacity decrease under low or high temperatures | Temperature control measures |
Actual test data: When signal strength drops from -70dBm to -105dBm, power consumption can increase by 3-5 times. Frequent retransmission attempts in weak signal areas are the main reason for rapid battery depletion.
Problem 4: Alarms are not triggered or pushed
| Steps | Check Items | Possible Causes | Troubleshooting |
| #1 | App Notification Permissions | Disabled by System | Enable Notification Permissions |
| #2 | Platform Configuration | Rules Not Configured Incorrectly | Check and Reconfigure |
| #3 | Device Sensors | Sensor Malfunction | Trigger Test, Observe Logs |
| #4 | Network Latency | Push Channel Congestion | Check Cloud Status |
Problem 5: Missing historical trajectory
| Phenomenon | Possible causes | Verification method | Troubleshooting |
| No data during certain periods | Signal dead zone | Check for buffering during this period | Confirm buffering mechanism is working properly |
| Discontinuous trajectory | Long reporting interval | Calculate theoretically required locations | Shorten reporting interval |
| Imperfect trajectory curvature | Wi-Fi or LBS positioning | Check if Wi-Fi or LBS positioning is enabled during playback | Enable Wi-Fi and LBS positioning data in the background |
| Long period without data | Device offline | Check device online status | Troubleshoot according to the "Device offline" procedure |
Key technical points: Devices with caching capabilities will store data locally when there is no signal and automatically retransmit it after the signal is restored. If retransmission fails, it may be due to a full cache or a malfunction in the retransmission mechanism.
Problem 6: Inaccurate Health Data of Smartwatches

Health monitoring (heart rate, blood oxygen, blood pressure, body temperature, sleep, steps) and safety features (fall alarm, sedentary reminder) of smart wearable devices are the functions that users are most concerned about and most likely to have doubts about. These functions involve multiple sensors and complex algorithms, and their accuracy is affected by a variety of factors.
| Data Types | Possible causes | Technical Reasons | Verification Methods | Optimization Suggestions |
| Heart Rate Monitoring | Unstable readings during strenuous exercise, large deviation from professional equipment | Optical heart rate sensors are susceptible to motion artifacts, wearing tightness, and skin color. | Comparison with medical heart rate monitors in a resting state; comparison under different exercise intensities | Ensure a snug fit; tighten the strap appropriately during exercise; static measurements are more accurate. |
| Blood Oxygen Saturation | Large fluctuations in readings, unable to measure during low perfusion | Based on photoplethysmography, they are affected by blood perfusion, skin temperature, and wearing position. | Comparison with medical finger-clip pulse oximeters (simultaneous measurement comparison) | Keep your arm still; avoid measuring in cold environments; ensure the sensor is clean. |
| Blood Pressure Measurement | Unstable readings, large discrepancies with electronic blood pressure monitors | Currently, most consumer-grade watches rely on PPG signal estimation, not direct measurement; individual calibration is required. | Comparison with upper arm electronic blood pressure monitors (same time, same posture) | First-time use requires calibration with a traditional blood pressure monitor; measure at the same time every day; maintain the same posture. |
| Body Temperature Monitoring | Fluctuating readings, significantly different from axillary thermometers | Skin temperature is greatly affected by ambient temperature, sweating, and wearing tightness. | Comparison with medical infrared thermometers | Avoid measuring immediately upon entering a different environment; wait for sweating to subside after exercise. |
| Sleep Monitoring | Indicates deep sleep even when awake; inaccurate total duration | Sleep algorithms based on motion recorders cannot distinguish between resting wakefulness and light sleep. | Comparison with sleep logs; comparison with professional polysomnography (PSG) monitors | Maintain a consistent wearing position; manually activate sleep mode before bed; use heart rate data to aid in judgment. |
| Pedometer Function | Walking not counted, arm swinging counted as steps | Step counting algorithms based on acceleration waveform characteristics have inappropriate threshold settings. | Comparison with manually counting 100 steps | Adjust step counting sensitivity; confirm wearing position. |
| Fall Down Alarm | No alarm for actual falls, false alarm for sudden sitting | Fall detection requires simultaneous fulfillment of multiple conditions such as impact, posture, and stillness, making threshold balancing difficult. | Simulated fall test (on a soft mat); recording of false alarms during daily activities | Adjust sensitivity based on user activity intensity; set alarm delay to avoid false alarms. |
| Sedentary Reminder | Alarms triggered despite movement, alarm triggered immediately upon sitting down | Based on continuous stillness time, they are insensitive to subtle movements. | Comparison of actual sedentary time with reminder times | Increase activity detection sensitivity; set do-not-disturb periods. |
Root Cause Analysis:
Health sensors in consumer-grade smartwatches use optical volumetric spectroscopy, calculating physiological parameters by observing changes in reflected light intensity when LEDs illuminate the skin and photodiodes receive these changes. This technology has inherent limitations:
Signal-to-noise ratio limitation: Interference from muscle activity during exercise is far greater than that from blood flow signals.
Individual differences: Skin color, hair density, and blood vessel depth affect signal quality.
Environmental interference: Changes in ambient light and temperature affect sensor readings.
Algorithm model: The calculation formula is based on population statistics, and individual bias is unavoidable.
The fundamental difference between medical-grade and consumer-grade
| Comparison | Medical-grade equipment | Consumer-grade smartwatch |
| Sensor Type | Dedicated medical sensors (e.g., ECG, finger-clip pulse oximetry) | General-purpose optical sensor (PPG) |
| Measurement Principle | Direct measurement (e.g., ECG signal, pulse oxygen absorption spectrum) | Indirect inference (based on an optical model of blood flow changes) |
| Calibration Requirements | Strictly calibrated at the factory, with regular maintenance | No calibration or relies on user self-calibration |
| Certification Standards | FDA and CE medical certifications | Consumer electronics certification |
| Accuracy Requirements | Error < ±2% | Acceptable error ±5-10% |
| Usage Environment | Controlled environment | Suitable for everyday dynamic environments |
This demonstrates that limitations in technical standards, testing methods, sensor accuracy, and the usage environment mean that even though the hardware and sensors used meet medical-grade standards, the device cannot be used as a medical device.
We explicitly inform all users that health data from smartwatches is for reference only and should not be used as a basis for medical diagnosis. At the same time, we continuously optimize our algorithms to maximize the value of this data in "trend monitoring" and "health reminders." Our advice to users is: use smartwatch data for trend monitoring rather than absolute values—focusing on trends is more meaningful than focusing on single values.
Problem 7: Inaccurate OBD2 GPS tracker data reports
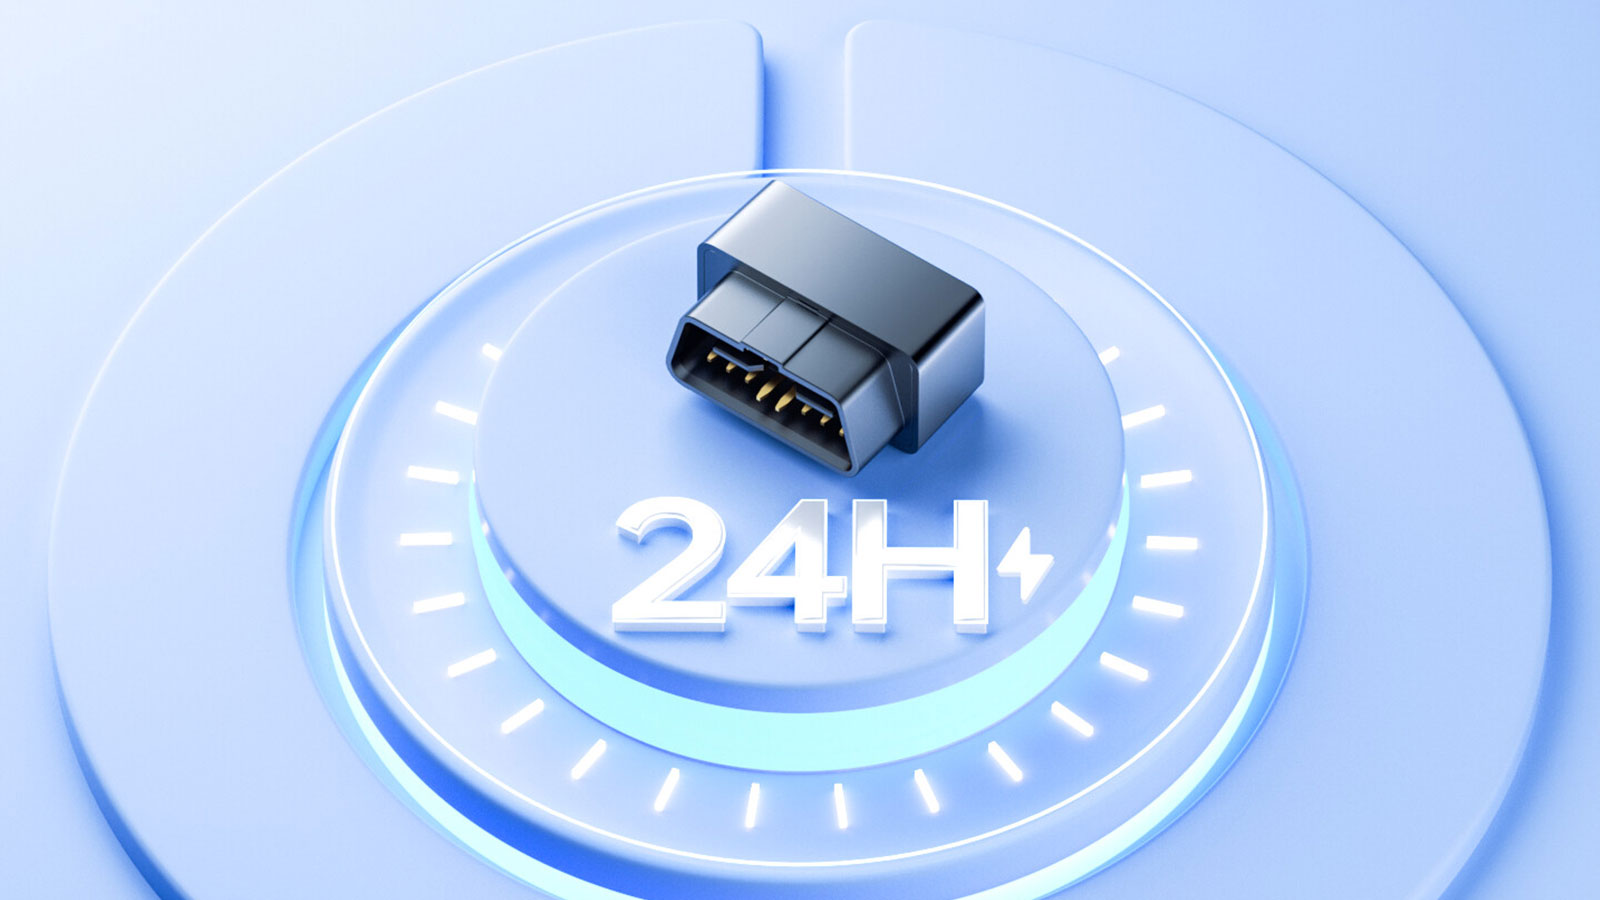
The OBD2 locator obtains fuel consumption, mileage, and driving behavior information by reading data from the vehicle's CAN bus, but users often report that the data does not match their actual experience.
| Data Types | Common Issues | Technical Reasons | Verification Methods | Solutions |
| Fuel Consumption | Displayed fuel consumption deviates significantly from actual refueling amount | Reading calculated values of injection pulse width and intake air volume, not direct flow measurement | Compare actual refueling amount with platform cumulative fuel consumption | Perform fuel consumption coefficient calibration; use long-term averages instead of instantaneous values |
| Mileage Statistics | Inconsistent with vehicle dashboard mileage | Pulse counting error, tire size variation, sampling frequency limitations | Compare with GPS trajectory mileage | Use both GPS mileage and OBD mileage, and choose the more reliable one |
| Driving Behavior | Frequent false alarms or missed alarms | Improper threshold setting, differences in vehicle characteristics | Record trigger points during actual driving | Adjust thresholds according to vehicle model; add duration judgment |
| Idle Speed Statistics | Inconsistent with actual idling duration | Disruption to the logic for judging engine speed > 0 when vehicle speed is 0 | Test with air conditioning on while parked | Add engine speed judgment + coolant temperature judgment |
Common causes of fuel consumption discrepancies
(1) Vehicle parameter mismatch: Different vehicle models have significant differences in fuel injector flow rate, engine displacement, and fuel type.
(2) Driving conditions: Frequent start-stop in congested traffic and rapid acceleration cause a sharp increase in instantaneous fuel consumption, amplifying the average calculation error.
(3) Temperature effects: Fuel consumption is significantly higher during cold starts than when the engine is warm.
(4) Fuel quality: Different octane ratings and brands of fuel have different combustion efficiency.
(5) Vehicle aging: Carbon buildup, clogged fuel injectors, etc., cause actual fuel consumption to exceed theoretical values.
Typical scenarios of misjudgment
| Scenario | False alarm type | Cause | Optimization method |
| Bumpy road surface | False alarm for rapid acceleration/braking | Vertical vibration is misjudged as horizontal acceleration | Use a high-pass filter to separate the gravity component |
| Incline start | False alarm for rapid acceleration | Influence of gravity component | Combined gyroscope to determine vehicle attitude |
| Curve + deceleration | Simultaneous triggering of sharp turn + hard braking | Compound action, sensor signal superposition | Add direction judgment and time window filtering |
| Towing/Heavy load | Normal acceleration is judged as rapid acceleration | Insufficient power leading to prolonged high throttle | Adjust threshold according to vehicle model |
IV. Advanced Diagnostic Tools and Methods
4.1 NMEA Data Analysis
The raw NMEA statements output by the GPS module contain a wealth of information. Analyzing this data can diagnose many problems.
| NMEA | Includes information | Diagnostic uses |
| $GPGGA | Time, location, number of satellites, altitude | Positioning quality, number of visible satellites |
| $GPGSA | Satellites involved in positioning, DOP value | Satellite geometry quality |
| $GPGSV | Details of all visible satellites | Signal strength, satellite distribution |
| $GPRMC | Recommended minimum positioning information | Base positioning data |
4.1.1 Key Indicator Interpretation
Satellite Count: >8 satellites - Good;<4 satellites - Unable to locate
HDOP (Horizontal Accuracy Attenuation Factor):
Signal-to-Noise Ratio (SNR): >40dB - Strong signal; 30-40dB - Moderate;<30dB - Weak signal
4.1.2 Where can you view this data?
If you've tried troubleshooting common problems without success, you can check the device status using specific SMS commands (the commands differ for each device). The returned SMS message contains this core information. Where can you obtain the device's SMS message list? Please contact us.
4.2 Cloud Log Analysis
Our platform allows you to view detailed device logs for the past 3 months, including:
Online/Offline Records: Understand changes in device online status
Command Issuance Records: Confirm whether remote commands were successfully delivered
Alarm Trigger Records: View alarm event details
Data Reporting Records: Understand the frequency and content of device reports
4.2.1 Where can you view this data?
If the device connect with our server, we will check from our server backend;
If the device connect with your own server, you need to check and share with us the data.
4.3 Log Catching Toolkit
We will provide proprietary field testing tools and software packages for real-time log capture, or you can purchase professional equipment locally to comprehensively capture and analyze all real-time data:
Spectrum Analyzer: Detects interference signals and measures signal strength
Portable Signal Generator: Simulates base station signal testing
Engineering Phone: Checks local network coverage and quality
External Antenna: Diagnoses internal antenna problems
Adjustable Power Supply: Tests equipment performance under different voltages
4.3.1 Where can you view this data?
We will share the toolkit if required.
VI. Frequently Asked Questions Quick Reference Table
| Problems | Most likely causes | Troubleshooting | Solutions |
| Device completely unresponsive | Battery depleted or hardware damaged | Charging Post-Test | Charging or returning for repair |
| Unable to register on network | SIM card problem or signal dead zone | SIM Card Replacement Test | Replace card or relocate |
| Slow location tracking | Cold start or weak signal | Check Satellite Count | Move to an open area |
| Inaccurate location | Multipath or geometric difference | View HDOP Value | Enable assisted positioning |
| Short battery life | Overly frequent reporting or weak signal | View Actual Reporting Interval | Adjust configuration |
| Missing tracking data | Signal dead zone or long reporting interval | Check Caching Mechanism | Shorten interval or increase buffer |
| No alarms received | Permission or rule issues | Trigger Test | Check configuration |
| Inaccurate heart rate readings | Loose fit or motion interference | Retest in Stationary State | Ensure fit, measure while stationary |
| Large fluctuations in blood oxygen levels | Low temperature or low perfusion | Retest after Warming Hands | Keep hands warm and stationary |
| Inaccurate temperature readings | Skin temperature is greatly affected by ambient temperature, sweating, and fit tightness | Retest in Stationary State | Compare with medical infrared thermometer |
| Large fuel consumption deviations | Uncalibrated or vehicle model incompatible | Record Comparison of 3 Refueling Volumes | Calibrate fuel consumption coefficient |
| False alarms during rapid acceleration | Low threshold or bumpy road surface | View Acceleration Value at the Time of the Event | Adjust threshold or enable filtering |
| App cannot be opened | Network or version problem | Check for Updates | Upgrade or reinstall |
VI. Conclusion

GPS tracking systems involve multiple components, including satellite signals, cellular networks, cloud platforms, and user-end apps. Problems in any of these components can affect the final experience. Health monitoring in smart wearables and fuel consumption and driving behavior assessments using OBD2 involve even more complex sensor technologies and algorithm models.
As a professional IoT solution provider, we recommend:
(1) Pre-testing: Thoroughly validate data before mass deployment.
(2) Reasonable expectations: Understand the technical boundaries of consumer-grade sensors.
(3) Continuous monitoring: Establish a health check mechanism.
(4) Data calibration: Regularly calibrate calculated data such as fuel consumption and health indicators.
(5) Professional support: Seek timely assistance for complex issues.
Huaten Global provides partners with comprehensive services, from testing tools and diagnostic guides to remote technical support. Whether you encounter deployment challenges or need to optimize existing solutions, our engineering team is always ready to assist.
For specific diagnostic issues, please contact technical support and provide the device ID, problem description, and relevant log screenshots.